The Most Dangerous Times to Drive in Colorado (2026 Study)
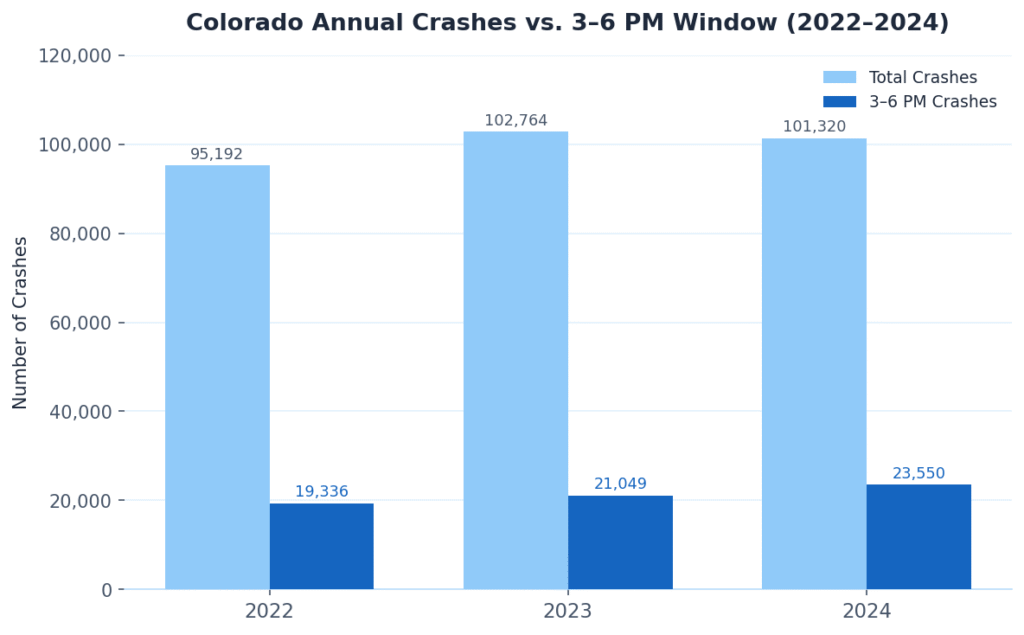
- The 3:00 PM to 6:00 PM window is Colorado's most crash-prone period, accounting for more than 20% of all annual collisions in 2023 and 2024 despite covering only 3 hours of the day.
- Fridays have the highest collision volume; Saturdays have the highest fatality rate per crash, nearly twice the weekday average.
- Fog is the deadliest weather condition per crash, with a fatality rate more than six times higher than clear-sky crashes in 2024.
- DUI risk peaks between 9:00 PM and 2:00 AM, with 2:00 AM reaching a 29.3% impairment rate in 2024, the highest single-hour figure in the dataset.
- Pedestrian fatality risk is more than twelve times the overall crash average, with the deadliest window running from 8:00 PM to 3:00 AM on weekends.
CGH Injury Lawyers analyzed three years of Colorado Department of Transportation crash data (2022 to 2024) to identify when and why Colorado roads are most dangerous. The findings reveal clear, predictable risk windows by time of day, day of week, season, weather, and road condition. If you were hurt in a Colorado car accident, understanding when crashes concentrate is one part of the picture. The other part is knowing your legal rights when a crash was not your fault.
Decoding Colorado's Traffic Safety Landscape
Road accidents are inherently unpredictable typically because their causation involves a wide range of factors. These factors include but are not limited to driver negligence, road conditions, driving behavior, lighting, weather conditions, and traffic density among others. Despite the increasing number of car accidents and wide range of contributory factors, we contend that traffic safety data can be systematically analyzed to identify patterns and trends that may improve predictability, strengthen preventive strategies and assist in policy-making.
Researchers and policymakers can identify trends in accident risk over time by analyzing crash reports and transportation databases. These patterns indicate the temporal occurrences of accidents, including specific hours, days, or seasons. Understanding these patterns is critical for improving road safety and guiding both policy interventions and driver awareness.
In recent years, road safety has gained increasing significance in Colorado. Preliminary statistics indicate that there were 701 fatalities due to traffic incidents on Colorado roadways in 2025 (Source: CDOT Preliminary Traffic Fatality Report, Jan. 23, 2026). This represents a little increase from the previous year and indicates that driving remains hazardous. Although fatalities constitute a minor fraction of all collisions, the average incident number in the state stands at 100,000 annually. This illustrates the magnitude of road safety issues for both motorists and regulatory bodies. The Colorado State Department of Transportation's Crash Data Reports consistently indicate that collision rates peak during periods of high travel and heavy traffic.
Research indicates that the majority of accidents occur throughout the late afternoon and early evening, particularly between 4:00 PM and 8:00 PM. This is primarily due to commuting congestion, fatigued drivers, and diminished visibility at dusk. In Colorado, collision investigations indicate that the afternoon and early evening are the most perilous periods for accidents, demonstrating the impact of daily traffic patterns on road safety.
Through this analytical study, we seek to examine these statistical dynamics in greater detail by analyzing crash data reports, weather reports and other publicly accessible data across Colorado to determine the most dangerous times to drive in 2026.
The objective of the research is to identify high-risk driving time periods by examining the frequency of crashes in relation to the time of day, day of the week, and other contributing factors. This data-driven approach has the potential to help commuters, policymakers, and transportation agencies create customized safety policies. Ultimately, individuals can devise proactive strategies to reduce the frequency of accidents, increase awareness of road safety, and improve the safety of transportation systems throughout the state by identifying the most probable accident times.
Research Methodology: Analyzing Three Years of State Transit Data
This study utilizes a quantitative, data-driven research methodology to discern temporal patterns in motor vehicle accidents within the State of Colorado. The research primarily relies on the examination of official collision databases and associated environmental data to determine if particular times, days, or conditions are indicative of an increased probability of traffic accidents. We have only relied upon state provided publicly accessible data to ensure reliability, accuracy and comprehensiveness of the analysis. Primary data collection sources include the Colorado Department of Transportation (CDOT) Crash Data Portal, which entails statewide crash data reported by law enforcement agencies, including information regarding crash timing, severity, and environmental conditions. We have secured Fatality records from the National Highway Traffic Safety Administration (NHTSA) Fatality Analysis Reporting System (FARS) database. This database contains detailed nationwide records of fatal motor vehicle crashes and provides standardized fatality data suitable for comparative analysis. Supplementary crash information will also be drawn from reports produced by the Colorado State Patrol, which investigates and documents traffic collisions across Colorado highways. A very important research point in this thesis is the environmental influences on crash occurrence. We have collected historical weather data from the National Weather Service. This will enable the study to correlate accident frequency with meteorological conditions such as precipitation, snow, fog, and visibility levels.
The data for the investigation is analyzed over a three-year period, from January 1, 2022, to December 31, 2024. We have extracted a set of key variables necessary to identify temporal and situational risk factors associated with roadway crashes. These variables include the following factors: Crash timestamp, crash date, day of the week, month of occurrence, crash outcome (fatality, injury, or property damage only), substance abuse, pedestrian involvement, weather and lighting conditions, and geographical classification.
Statistical and temporal analytic techniques will be employed to structure and examine the acquired data. Crashes will be categorized by time of day, day of the week, and month to identify patterns and periods of elevated risk. Cross-tabulating variables such as weather, lighting, and substance usage will elucidate whether particular contextual factors increase the likelihood of crashes at different times. The objective of this research is to deliver a comprehensive temporal risk profile of driving conditions in Colorado by integrating crash information with environmental data. These variables enable researchers to investigate correlations between the frequency of crashes and time-related factors. This enables the identification of the most hazardous driving periods in the state during the study duration.
The "Danger Zone": Why 3:00 PM to 6:00 PM is Getting Deadlier
The number of motor accidents in Colorado state over the three year research period (2022 to 2024) are generally witnessing an increasing and consistently high trend. In 2022, the total number of reported accidents as per the CDOT, Crash Data Portal was 95,192. Subsequently in 2023 and 2024, CDOT reported a total number of 102,764 and 101,320 accidents respectively. A closer review of this three year data predicts a trend. It consistently suggests that the late afternoon and early evening rush hour is the most dangerous time to be on Colorado roads. In year 2022 there were 19,336 crashes between 3:00 PM to 6:00 PM out of the total 95,192 crashes all around the year. This accounts for 20.27% of all year round accidents in just 3 hours. Subsequently, in 2023 the review of this data tells the same story. Reportedly there were 21,049 accidents between 3:00 PM to 6:00 PM out of the total 102,764 which accounts for nearly 20.48% of all year round accidents in just 3 hours. In 2024, these hours accounted for 23,550 motor vehicle crashes out of all crashes which accounts for nearly 23.24% of all year-round accidents in just 3 hours. It is evident that 3:00 PM to 6:00 PM rush hour is the most accident prone time and is getting worse year by year.
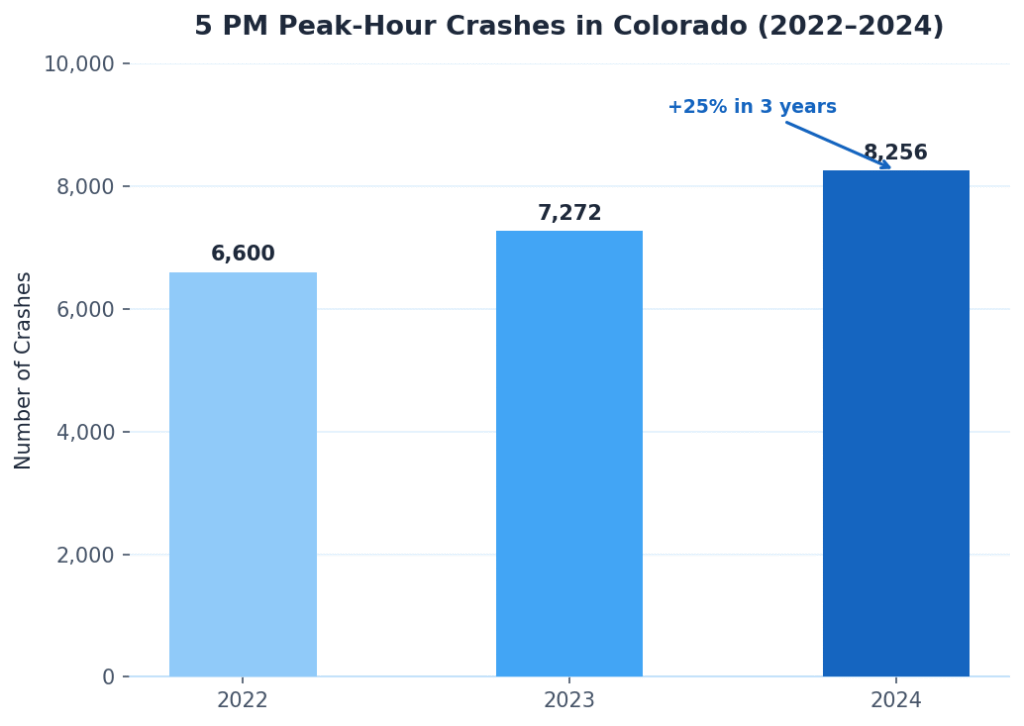
Between these hours, it appears that 5:00 PM is the single most dangerous hour to be on the road. The congestion at 5 PM is getting worse. The 5 PM peak hour has increased from 6,600 in 2022 to 7,272 in 2023, and further to 8,256 in 2024, representing a concerning trend over the past three years. That constitutes a 25% increase over a mere three years, resulting in over 1,700 additional accidents during peak hours. The importance of these findings lies not just in the trending increase in numbers but also in its implications for understanding peak congestion dynamics. The 5:00 PM hour typically coincides with the convergence of numerous risk factors such as a heightened volume of individuals commuting to work, diminished driver concentration due to fatigue after a lengthy day, an increase in aggressive or time-sensitive drivers, and, during certain seasons, deteriorating light conditions. These characteristics appear to be deteriorating over time, resulting in a quantifiable and increasing incidence of collisions. Notably, the research indicates that this peril is not static, it is increasing over time.
At the same time, it is also encouraging to observe that certain time blocks are improving. For instance, the morning rush hour from 7:00 AM to 9:00 AM remains congested but even then the volume of incidents and collisions is seen to stabilize or decrease relative to 2023. This is a possible indication of improved traffic distribution, alterations in commuting behaviors (such as adopting flexible work hours), or enhanced management of infrastructure during peak morning periods coupled with stronger implementation of laws. The incidence of collisions during the nocturnal hours (1:00 AM to 5:00 AM) is also seen to decrease -- from 10,115 in 2023 to 6,901 in 2024. This improvement can be a result from improved law enforcement, reduced nocturnal mobility, or increased public awareness of hazardous behaviors such as driving under the influence. The comparative data reveals two distinct narratives. The certain off-peak and morning periods exhibit significant safety enhancements, whereas the evening peak, particularly about 5:00 PM, remains the most perilous and growing problematic time. This disparity indicates that policy modifications and safety protocols may be effective during lower-risk periods, however they are insufficient to address the systemic challenges posed by evening traffic congestion. The results indicate that, from a policy and risk management perspective, it is imperative to concentrate on late-afternoon strategies, such as improving traffic flow, staggering work schedules, and enforcing harsher regulations during peak traffic periods.
Fridays vs. Saturdays: The Distinction Between Volume and Fatality
A review of the three year data (2022 to 2024) shows two very important insights. First, Friday is the day with maximum number of collisions. Second, Saturday is the day with highest DUI incidents and fatalities.
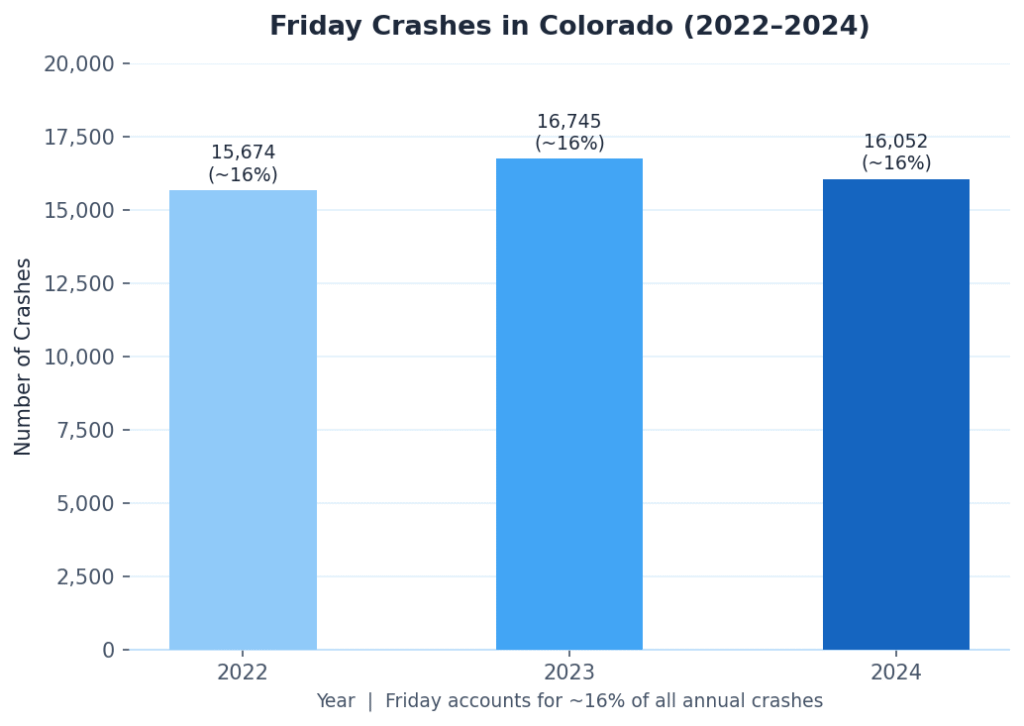
Most collisions across the week happen on Fridays and that trend is consistently increasing. This pattern demonstrates both ranking consistency and volume persistence, rendering it a critical factor for temporal risk assessments. This differs from single or variable trends. As per the CDOT crash reports, 15,674 (approx. 16% of all cases in the year) accidents were reported on Fridays in 2022, 16,745 (approx. 16% of all cases in the year) accidents were reported on Fridays in 2023, and 16,052 (approx. 16% of all cases in the year) accidents were reported on Fridays in 2024. We suspect Friday's elevated risk is due to a combination of several behavioral and situational factors. Fridays constitute the most hectic days of the week, signifying the conclusion of the workweek and the commencement of the weekend. During the afternoon and evening, diverse individuals, including commuters, leisure travelers, and long-distance motorists, concurrently use the same roadways. Increased traffic correlates with heightened driver fatigue, intensified pressure to complete the workweek, and a propensity for inattentive or aggressive driving behaviors.
At the same time, Friday has consistently held the number one position across the past three years. Friday also happens to be the only day with a rising number of Driving Under Influence (DUI) cases, which makes it a double risk. Alcohol-impaired driving is more prevalent in social contexts, such as dining out, nightlife activities, and travel. Friday is particularly hazardous because of increased traffic exposure and a heightened probability of impairment-related accidents, which are strongly associated with severe and fatal collisions. These results imply that Fridays should be a priority time for focused interventions, such as more DUI enforcement checkpoints, public awareness campaigns against impaired driving, and traffic management measures during peak times. The data also suggests that individual drivers need to be more vigilant on Fridays, especially in the late afternoon and evening when there are the most traffic and impairment risks.
Saturdays are the most dangerous days for fatal outcomes. Saturdays exhibit a greater mortality rate than weekdays, with approximately 1.34% of accidents resulting in fatalities, in contrast to roughly 0.65% on weekdays. This indicates that Saturdays are nearly twice as lethal per collision. This disparity indicates that accidents occurring on Saturdays are more severe, despite their lower frequency. A driver involved in a collision on a Saturday is far more likely to sustain fatal injuries than one involved in an accident on a typical weekday. At the same time, the data we have analyzed also reveals a less apparent although equally significant trend. Mondays are the day with the highest incidence of crashes in Colorado and this is an upward trend. Over the three-year study period, the average number of crashes on Mondays increased from 248 in 2022 to 272 in 2023, and subsequently to 277 in 2024. This is a total increase of approximately 12%. This trend is significant not due to Mondays now experiencing the highest number of crashes, but because they exhibit the most consistent upward trajectory, indicating an escalating danger over time.
Seasonal Hazards: The Lethal Paradox of Fog and Winter Weekdays
The most severe single-day crash increases are not random. They follow seasonal and behavioral patterns that happen again and over again. The data shows that the worst days for individual crashes (high fatality rate) each year tend to be on winter weekdays. This strongly suggests that bad weather, like snowstorms, ice roads, and low visibility, is to blame. Data suggests that visibility conditions such as fog account for the highest fatality rates and it is getting worse year by year, despite a reduction in the number of crashes. For instance, in 2024, the number of fog crashes dropped by almost half, but the number of deaths more than tripled. This means that fog conditions in 2024 were over six times more deadly per crash than in 2023. This is the most worrying change from one year to the next in the whole dataset.
The Holiday Risk Profile: From MLK Day Surges to Thanksgiving Ebb
Martin Luther King Jr. Day (MLK Day) is the most concerning holiday, since the incidence of collisions increased sharply -- from 187 in 2022 to 265 in 2023, and subsequently to 407 in 2024. This figure exceeds three times that of three years prior, establishing it as one of the most rapidly expanding high-risk days in the dataset. This increase may result from a combination of extended weekend excursions, winter conditions, and greater mobility for leisure activities, all of which heighten the likelihood of accidents.
Thanksgiving is a compelling illustration of this concept. The research indicates that Thanksgiving Day is quite safe for riders, perhaps due to a decrease in travel as individuals remain at home to commemorate the occasion. However, this apparent safety is offset by the elevated risk on the days preceding and after travel, particularly the Wednesday before Thanksgiving, which frequently ranks as one of the most perilous days (among Top 5 accident prone) of the three year period that we are analyzing. This rise results from numerous individuals commuting simultaneously, sometimes under time constraints and in congested conditions, over extensive distances.
Seasonal related risks necessitate infrastructure preparedness, road maintenance, and real-time meteorological notifications. Holiday-related risks may necessitate traffic management strategies, staggered travel recommendations, and enhanced enforcement during peak travel periods. The most perilous days on Colorado roadways occur when weather conditions and driving behaviors are both foreseeable. Winter weekdays and travel periods preceding holidays are the most perilous times.
DUI Trends: The "Closing Time Effect" and the 2:00 AM Peak
Review of the past three years' data sets suggests a general positive outcome for DUI cases on Colorado roads. There is a general year on year downward trend on cases of substance abuse while driving. The overall substance (Alcohol, Marijuana, and other substances) rate in percentage terms found in all recorded crashes has gone down from 7.58% in 2022 to 6.96% in 2024. Alcohol which is the highest consumed substance in the reported DUI cases, has also gone down from 6.57% to 6.13%. Marijuana use has gone down from 1.13% to 0.95%. Other drugs rate has also gone down from 1.47% to 1.16%.
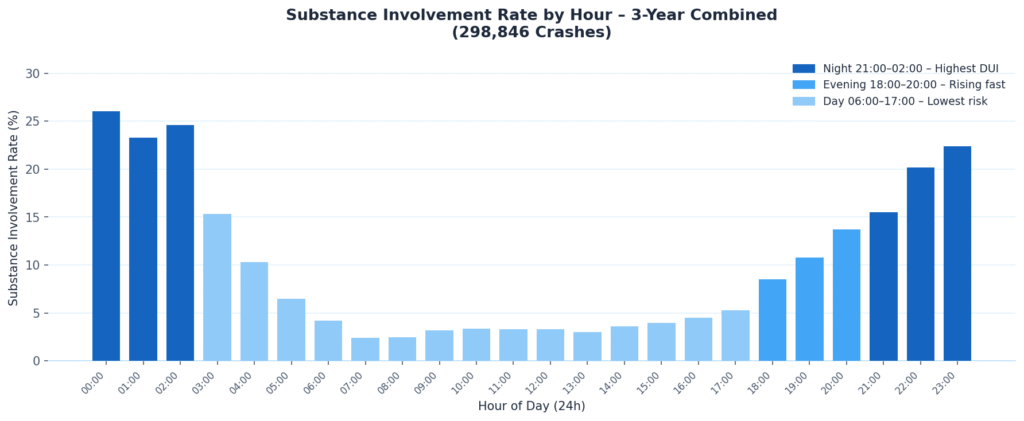
While there is reduction, DUI is still happening in the state. Majority DUI cases are found in nocturnal hours (9:00 PM to 2:00 AM) and this trend is significant across the data set reviewed for the three years. Every hour during the nocturnal hours has more than 15% drivers, who are driving under influence or a certain drug or alcohol. Contrastingly these numbers fall between 2 to 5% during the day time. It is conceivable that 2:00 AM is more detrimental than midnight. Midnight maintains a consistent rate of 26% over all three years, however 2:00 AM recorded a rate of 29.3% just in 2024, representing the highest percentage for any single hour in any year. This phenomenon could possibly be the result of closing-time effect where bars cease operations and intoxicated drivers depart immediately upon closure. Interesting, rush hour which has the most number of accidents recorded in the past three years is the safest DUI window. The high volume of traffic dilutes DUI proportion and most crashes at peak hours are sober driver collisions. The maximum cases of DUI are seen over the weekend over the span of three year period as opposed to the weekdays.
These findings have a clear and actionable implication: law enforcement and public safety resources can be better targeted by focusing efforts between 10:00 PM and 3:00 AM, especially on Fridays, Saturdays, and during high-risk holiday travel periods like Thanksgiving and Winter Break. This time period regularly recorded the highest incidence of DUI-related occurrences over the past three years, rendering it the most critical moment for intervention.
If you were hit by a drunk driver in Colorado, the data above underscores how foreseeable these crashes are. A driver who gets behind the wheel after closing time on a Friday night is making a choice that puts everyone on the road at risk. CGH Injury Lawyers represents people hurt by those choices.
Visibility and Velocity: How Weather and Lighting Compound Risk
The crash data from Colorado over three years reveals a significant and occasionally unexpected correlation between weather conditions and the timing of road incidents. The majority of collisions occur under clear skies, a trend consistent throughout all three years and evident more than 80% of the time. This occurs primarily when the weather is favorable. However, analyzing the fatalities resulting from crashes rather than the total number of incidents provides a more lucid understanding of the genuinely hazardous situations. Fog constitutes the most perilous meteorological condition in the dataset. Fog accounts for a minor proportion of accidents (183 in 2024 and 316 in 2023) yet the fatalities it induces are notably elevated. In 2024, fog-related accidents resulted in fatalities for 3.83% of individuals, exceeding six times the incidence rate of accidents occurring under clear weather conditions. In 2023, the rate was lower at 0.63%. This indicates that fatalities due to fog are erratic and contingent upon particular occurrences; yet, the three-year trend demonstrates that fog constitutes a disproportionately lethal meteorological phenomenon. Wind constitutes an additional hazard that receives insufficient consideration. The death rate is approximately 1.6 to 2.0% consistently, which is consistently double the baseline observed in clear weather conditions. Snow ranks as the third most prevalent cause of accidents in Colorado, however it exhibits one of the lowest fatality rates in the dataset, approximately 0.24% in both analyzed years. One logical explanation is that drivers evidently reduce their speed in snowy conditions, resulting in less severe collisions despite their increased frequency. The same rationale pertains to rain, which results in numerous accidents but few fatalities. This indicates that challenges related to snowfall and rainfall pertain more to the frequency of accidents than their severity. There is an increase in crashes, albeit a decrease in fatalities per crash.
The weather conditions are further exacerbated by the lighting. The mortality rate on poorly illuminated roads is approximately 1.45 to 1.48% over three years, nearly thrice the daytime rate of roughly 0.47 to 0.49% in all crash cases. Adverse weather conditions occurring concurrently with unilluminated roadways such as fog or wind during nighttime on streets devoid of streetlights result in the highest mortality rates among the whole dataset.
Vulnerable Road Users: The Critical Window for Pedestrian Safety
Between 2022 and 2024, Colorado experienced 3,857 pedestrian crashes, leading to 333 fatalities and 3,223 injuries. The pedestrian fatality rate of 8.63% exceeds the overall accident fatality rate of 0.69% by more than twelvefold. Pedestrians constitute the most vulnerable group on Colorado streets. The rate fluctuated from year to year, increasing from 8.78% in 2022 to a peak of 9.29% in 2023, before declining to 7.81% in 2024. This indicates that specific safety measures may be proving effective, however the three-year average remains elevated.
If you were injured as a pedestrian in Denver or anywhere in Colorado, the Denver car accident lawyers at CGH handle pedestrian injury claims and can evaluate who is responsible under Colorado law.
The timing of pedestrian accidents can be described in two distinct manners, contingent upon their frequency or severity. The majority of accidents occur in the afternoon and early evening, according to crash statistics. The peak hour varies annually as follows: 5 PM in 2022 recorded 84 crashes, 6 PM in 2023 recorded 97, and 3 PM in 2024 recorded 107 crashes. This possibly occurs due to the dismissal of school, individuals commuting to work, and pedestrians traversing the area during those hours. The interval between 3 and 7 PM consistently has the highest incidence of pedestrian accidents, attributable to the significant volume of vehicles and individuals on the roadway during this period. However, when the sole consideration is the number of fatalities, the perspective shifts entirely. From 8 PM to 3 AM, collisions are more fatal than during any other period of the day. The 10 PM hour exhibits a 21.3% mortality rate across the three-year aggregated dataset. This indicates that over twenty percent of pedestrian accidents during that time resulted in fatalities. At midnight, the mortality rate is 27.6%, whereas at 3 PM, it is merely 1.8%, the peak hour for pedestrian accidents. The peril of late-night driving is attributed to reduced visibility, increased speeds of vehicles on quieter routes, pedestrians clad in darker attire, which complicates detection by drivers, and a significant rise in intoxicated drivers post-9 PM, as evidenced by DUI statistics.
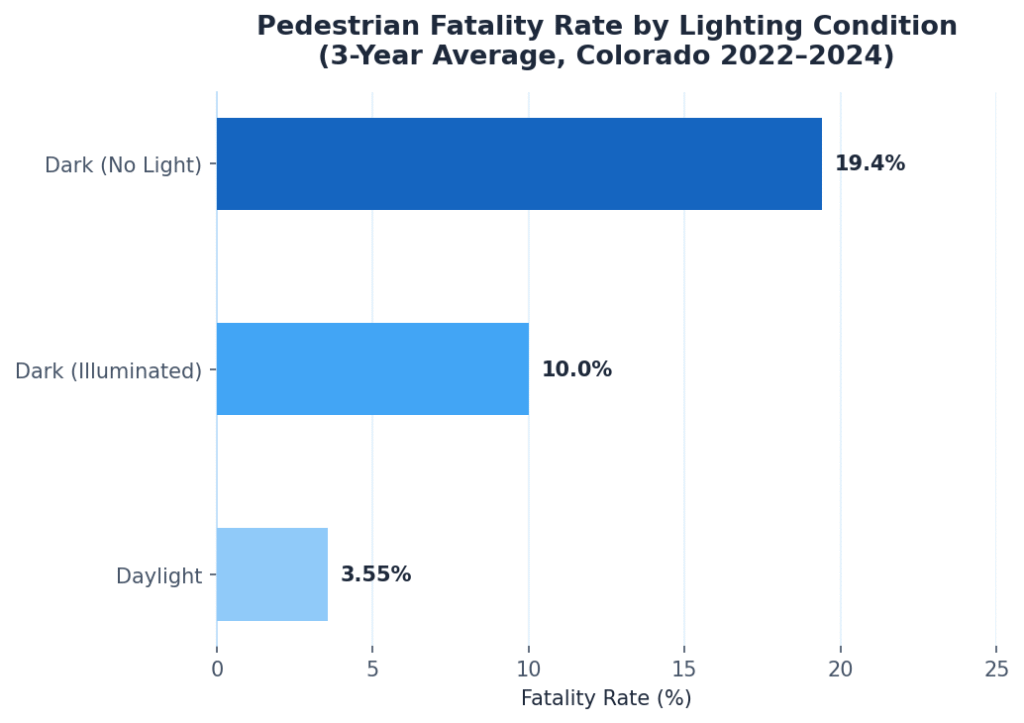
In the last three years, the pedestrian fatality rate on poorly illuminated roads has been 19.4%. Conversely, it has been merely 3.55% during the day. This quintuple gap underscores the critical significance of illumination for survival. Annually, October, November, and December experience the highest incidence of pedestrian collisions, with November recording the peak in 2023 (160), while December registered the highest in 2022 (141) and 2024 (145). During autumn, the sun sets earlier, rendering the evening rush hour more hazardous by transforming a typically manageable afternoon period into a treacherous twilight and darkness. The pedestrian fatality rates are 11.45% on Saturdays and 11.25% on Sundays. This exceeds the everyday norm of 7 to 9%. This is due to an increased number of individuals traversing the streets late at night on weekends, coinciding with the peak of drunk driving incidents. The data clearly indicates that the majority of pedestrian accidents transpire in the afternoon, yet, the hours post-sunset, particularly on weekends from 9 PM to 3 AM, are when these incidents are most likely to be fatal.
Core Findings for the Colorado Commuter
There are very apparent and consistent patterns in the crash data from all around Colorado State during the three years (2022 to 2024). These patterns show when and why roads are most dangerous. The most dangerous time for crashes is between 3:00 and 6:00 PM. More than 20% of all crashes in 2023 and 2024 happen during this time. Every year, this window got worse. In 2022, there were 19,336 crashes, and in 2024, there were 23,550, an increase of more than 21% in three years. It is the most important trend in the dataset. Weather conditions create a large and separate risk. Many accidents happen when it snows or rains, but not many people die since drivers go slower when it snows or rains. Out of the three years, fog is the worst weather condition. In 2024, crashes that happened in fog had a fatality rate of 3.83%, which is approximately six times greater than crashes that happened while the weather was clear.
It's a good sign that substance use in collisions has gone down a lot in the last three years. But the drug rate on Thanksgiving Day was roughly the same in 2023 and 2024 (16%). The substance rate, on the other hand, increased up from 6.99% in 2022 to 9.47% in 2024, which was not what was expected. Between 9 PM and 2 AM on weekends, there are always more DUIs than at any other time of day during the course of all three years. The safety of people walking is still the most crucial thing. The fatality rate for pedestrians in the last three years was 8.63%, which is approximately twelve times the average for all crashes. The worst crashes happen not in the bustling daytime hours, but in the late-night hours when darkness, speed, and impairment come together in the most hazardous way.
Future-Proofing Colorado Roads: Policy Implications and Conclusions
A three-year analysis of Colorado State collision records from 2022 to 2024 indicates that road safety is improving in specific areas while deteriorating in others. The distinction between these two trends must be examined meticulously. The research indicates that road safety in Colorado is not a uniform issue requiring a singular solution. Three unique, predictable, and measurable danger windows necessitate targeted and individualized intervention: the 3 PM to 6 PM commute, foggy conditions on lighted roadways, late-night weekend hours, and specific vacation periods.
RESOURCES
- Colorado Department of Transportation Crash Data Portal, Crash Data for years 2022, 2023 and 2024, accessible at: https://www.codot.gov/safety/traffic-safety/data-analysis/crash-data
- Colorado Department of Transportation, Fatal Crash Data for years 2022, 2023 and 2024, accessible at: https://www.codot.gov/safety/traffic-safety/data-analysis/fatal-crash-data
- National Weather Service historical weather data, accessible at: https://www.weather.gov/help-past-weather
- Centers for Disease Control and Prevention, accessible at: https://wisqars.cdc.gov/
Frequently Asked Questions
What is the most dangerous time of day to drive in Colorado?
The 3:00 PM to 6:00 PM window is the most dangerous period on Colorado roads by crash volume. In 2024, that three-hour window accounted for 23,550 crashes, or about 23.24% of all accidents for the year. The 5:00 PM hour alone saw crashes rise 25% over the three-year study period from 2022 to 2024. Contributing factors include peak commuter traffic, driver fatigue, and reduced visibility at dusk in the fall and winter months.
Which day of the week has the most car accidents in Colorado?
Friday consistently has the highest total crash volume, accounting for roughly 16% of all weekly crashes across the three-year study period. However, Saturday has the highest fatality rate per crash, with approximately 1.34% of Saturday collisions resulting in fatalities compared to about 0.65% on weekdays. Friday is worst for total crashes and rising DUI rates; Saturday is nearly twice as deadly per collision.
What weather condition causes the most deadly crashes in Colorado?
Fog. Despite accounting for a small fraction of total crashes (183 in 2024), fog produced a 3.83% fatality rate in 2024, more than six times the rate for clear-weather crashes. Snow actually has one of the lowest fatality rates in the dataset (about 0.24%) because drivers reduce their speed. Fog is unpredictable and catches drivers at highway speeds with near-zero visibility, which is why it produces the most severe outcomes per crash.
When are drunk drivers most dangerous on Colorado roads?
Between 9:00 PM and 2:00 AM, especially on Fridays and Saturdays. Every hour in that window sees more than 15% of drivers involved in crashes testing positive for alcohol or drugs. The 2:00 AM hour reached a 29.3% impairment rate in 2024, the highest single-hour figure across the entire three-year dataset. This likely reflects the closing-time effect when bars shut down and impaired drivers leave simultaneously.
Are pedestrian accidents more dangerous at night in Colorado?
Yes, dramatically so. While most pedestrian crashes happen between 3 and 7 PM due to traffic volume, the fatal risk spikes sharply after dark. The 10:00 PM hour has a 21.3% pedestrian fatality rate across the three-year aggregated dataset; midnight reaches 27.6%. By comparison, the 3:00 PM peak hour has a fatality rate of only 1.8%. Poorly lit roads account for a 19.4% pedestrian fatality rate versus 3.55% during daylight. Weekend nights (9 PM to 3 AM) are when pedestrian deaths are most likely to occur.
This article is general information for Colorado drivers and injury readers. It is not legal advice, does not create an attorney-client relationship, and does not promise any particular legal outcome. Statistical figures are drawn from publicly accessible CDOT, NHTSA, and National Weather Service data for 2022 to 2024. If you were injured in a Colorado crash, your rights depend on the specific facts of your case and require individualized legal review.
IT'S MORE THAN MONEY.
Injured in a crash? We handle everything else.
Free consultation. No fee unless we win. Denver office serves all of Colorado.